使用 Excel 和 Python 进行数据可视化入门


文本分析是一种重要的技术,用于从非结构化文本数据中提取有价值的见解,这是自然语言处理 (NLP) 应用等的基础组成部分。在这篇博文中,我们将探索一种令人兴奋的新方法,即在熟悉的 Microsoft Excel 环境中使用 Python 进行文本分析,这要归功于功能强大的 Anaconda Distribution for Python。这种前沿功能将 Python 数据分析功能的优势与 Excel 用户友好的界面相结合,为高效且有效的文本分析开辟了全新的机遇。
注意:要重现本文中的示例,请安装 Excel 中 Python 的试用版。
文本分析的第一步是将文本数据导入到 Python 环境中。我们可以使用熟悉的库(如 pandas)直接从 Excel 读取数据。在本例中,我们有一个存储在“data”工作簿中的 20 个课程评论的集合。在单独的工作表中,我们可以通过简单地输入“=py”来开始编写 Python 代码。这使我们能够使用 df=xl(“data!A1:A20”, headers=True) 访问数据,从而生成 Python DataFrame 对象。
接下来,为了验证我们是否正确加载了数据,我们可以启动另一个 Python 环境,输入“=py”,并使用“df.head()”检查数据的前五行。这个快速而直接的步骤使我们能够确保数据已成功导入,并让我们初步了解初始记录以进行进一步分析。

在文本分析过程中,通常的做法是过滤掉停用词,停用词是指句子中频繁出现但缺乏实质性上下文含义的词语(例如,“a”、“the”、“and”、“but”等)。通过消除这些非必要的词语,我们可以专注于更相关的内容,并从文本数据中获得更有意义的见解。我们通常使用自然语言工具包 (NLTK) 库来下载停用词列表
from nltk.corpus import stopwords
stopwords_list = stopwords.words('english')
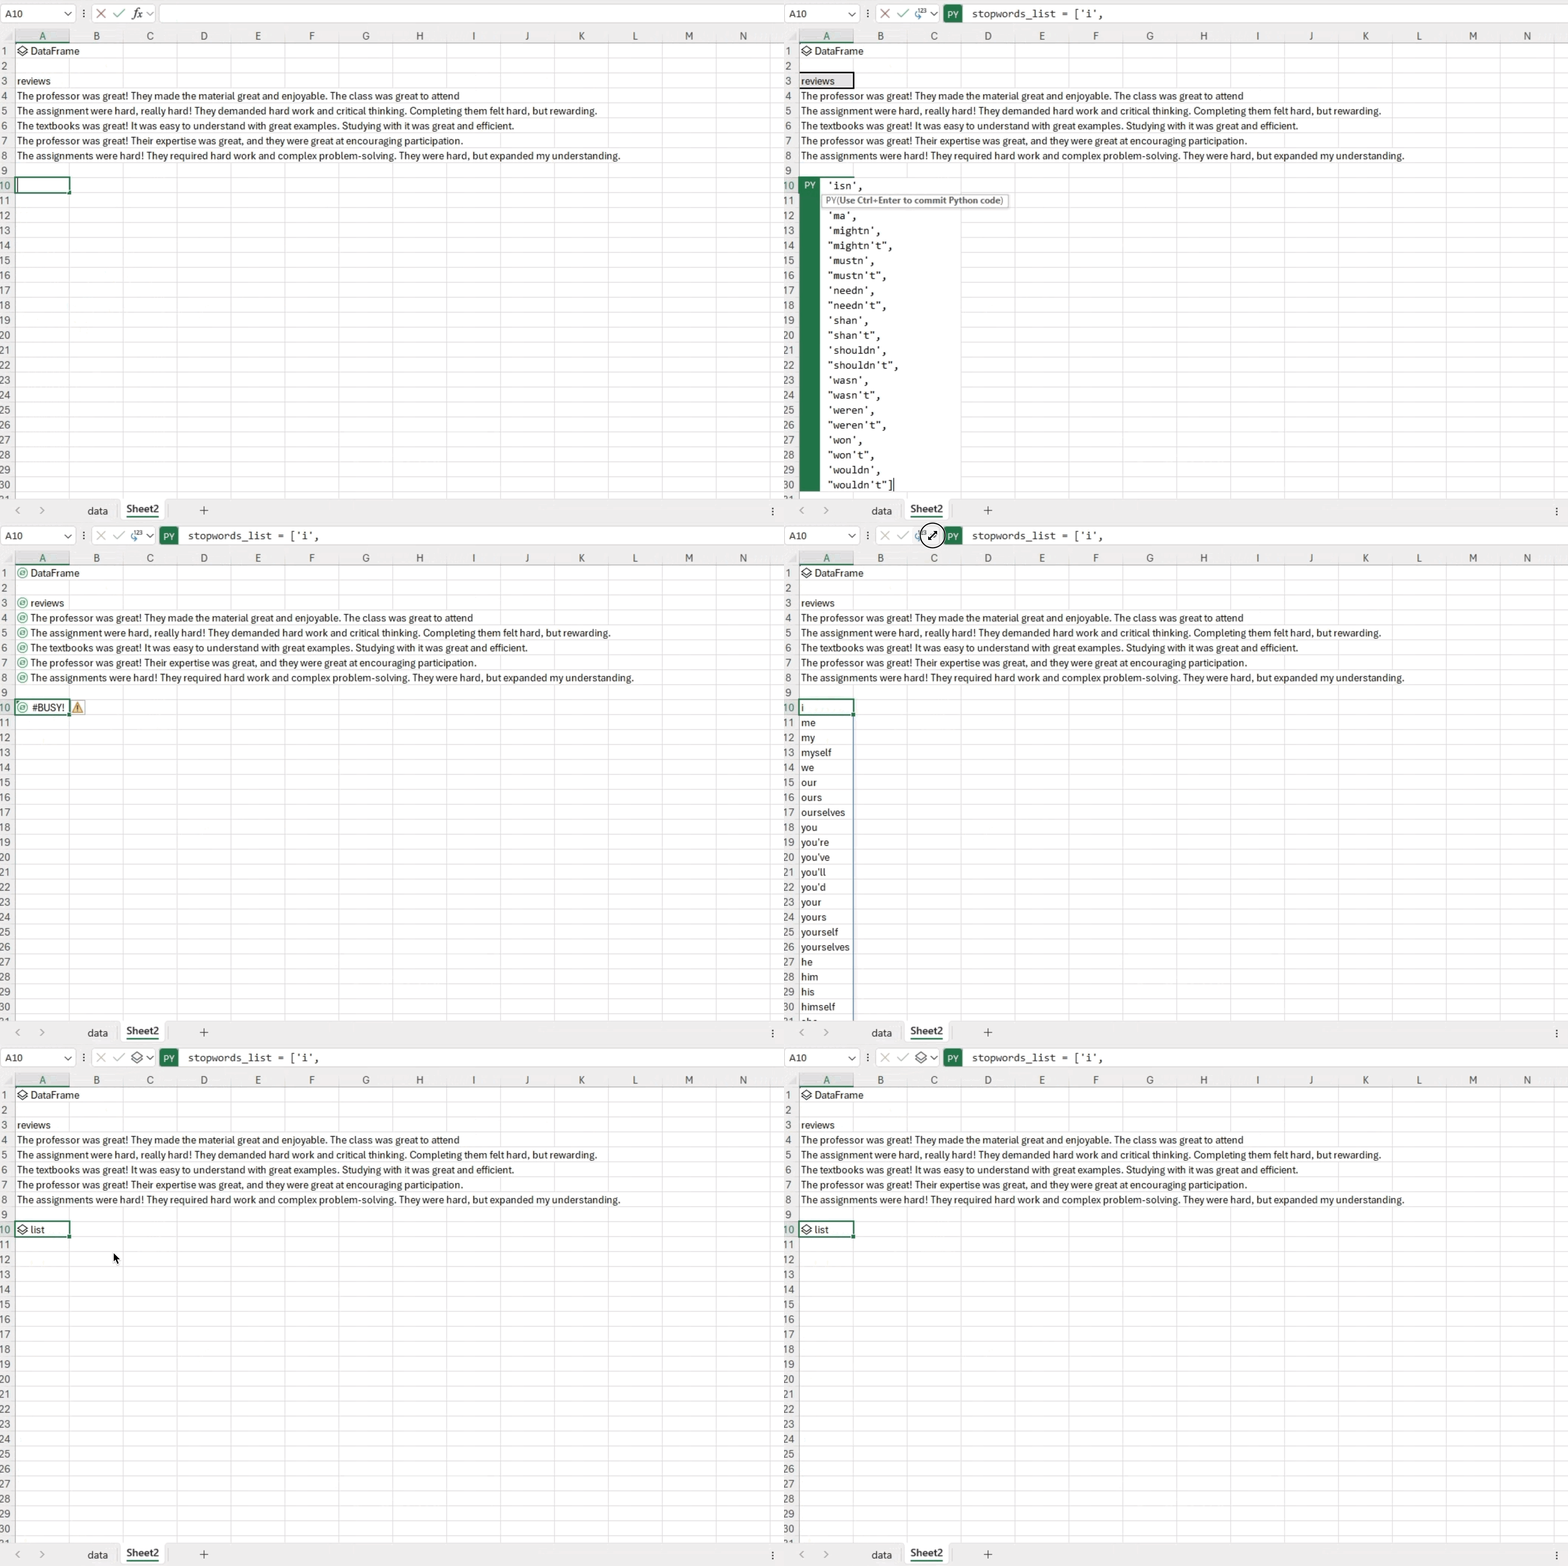
但是,当前版本的 Excel 中的 Python 不允许您下载 NLTK 通常需要的数据集。在我们等待解决方案的同时,我们可以直接在代码中定义我们自己的停用词列表。在下面的代码中,我们只是复制并粘贴了 NLTK 中的所有停用词。欢迎您自行定义停用词列表进行实验,看看它们如何影响结果。

N 元语法是从给定的文本样本中提取的连续词序列。N 元语法分析有助于理解词语之间的关系,并识别频繁出现的短语。在本节中,我们将研究两个词和三个词的组合,即二元语法和三元语法。
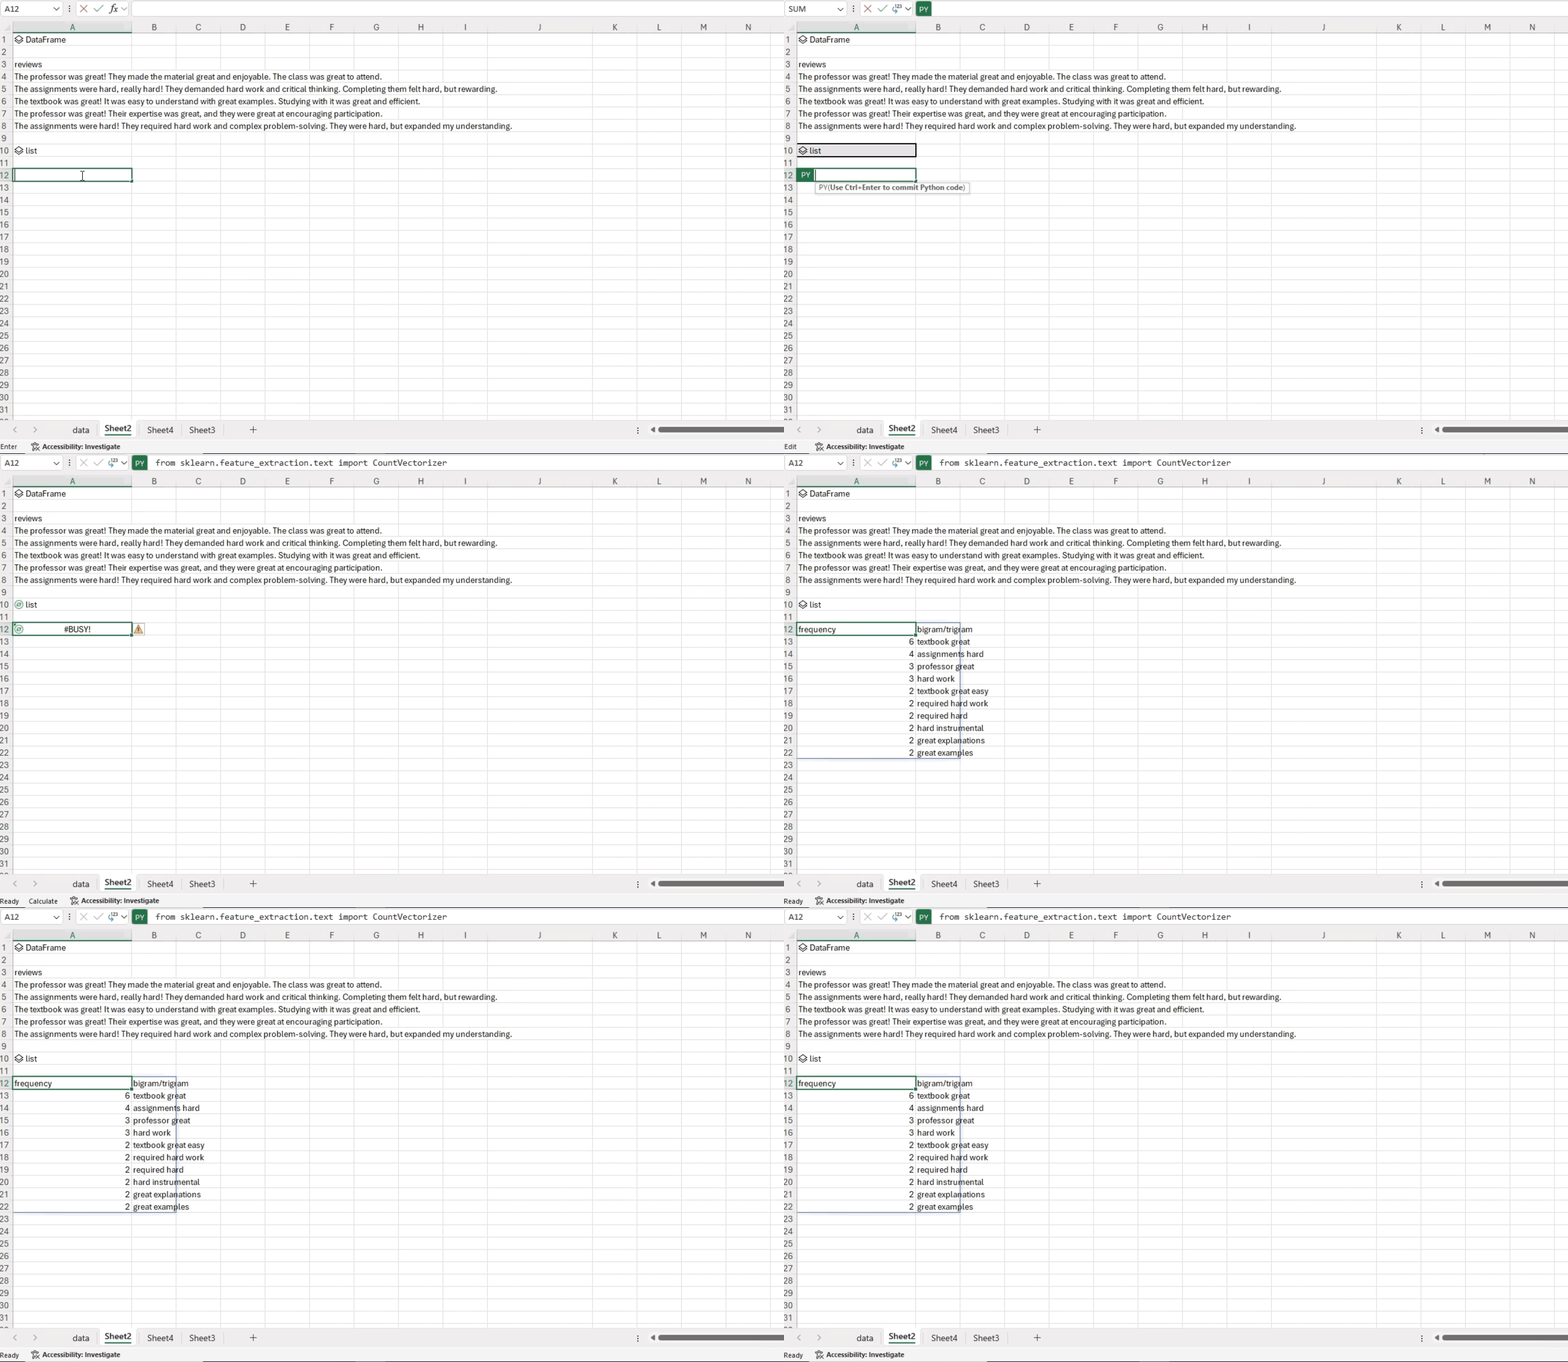
我们将使用 CountVectorizer 函数,该函数允许我们将文本文档集合转换为词语计数矩阵。ngram_range 参数定义了要提取的不同 n 元语法的 n 值的范围的下限和上限。在本例中,我们对二元语法和三元语法感兴趣。以下代码片段说明了如何获取所有二元语法和三元语法,按其各自的频率对其进行排序,并返回前 10 个二元语法/三元语法
from sklearn.feature_extraction.text import CountVectorizer

# Create CountVectorizer object
# CountVectorizer converts a collection of text documents to a matrix of token counts
c_vec = CountVectorizer(stop_words=stopwords_list, ngram_range=(2,3))
# Fit the CountVectorizer to the reviews data to get a matrix of ngrams
ngrams = c_vec.fit_transform(df['reviews'])
# Count the frequency of ngrams
count_values = ngrams.toarray().sum(axis=0)
# Get a list of ngrams
vocab = c_vec.vocabulary_
# Create a DataFrame to store the frequency and n-gram, sorted in descending order of frequency
df_ngram = pd.DataFrame(sorted([(count_values[i],k) for k,i in vocab.items()], reverse=True)
            ).rename(columns={0: 'frequency', 1:'bigram/trigram'})
# Display the top 10 n-grams by frequency
df_ngram.head(n=10)
分析显示,“textbook great” 这个短语出现了六次,而 “assignments hard” 在文本数据中出现了四次。这些特定词语组合的频繁出现为分析的文本中的模式提供了有价值的见解。

主题建模是一种用于发现文档集合中主要主题或主题的技术。它有助于组织文本数据,并提供底层信息的简洁表示。主题建模主要有两种模型:非负矩阵分解 (NMF) 模型和潜在狄利克雷分配 (LDA) 模型。在本例中,我们将使用 NMF 方法。
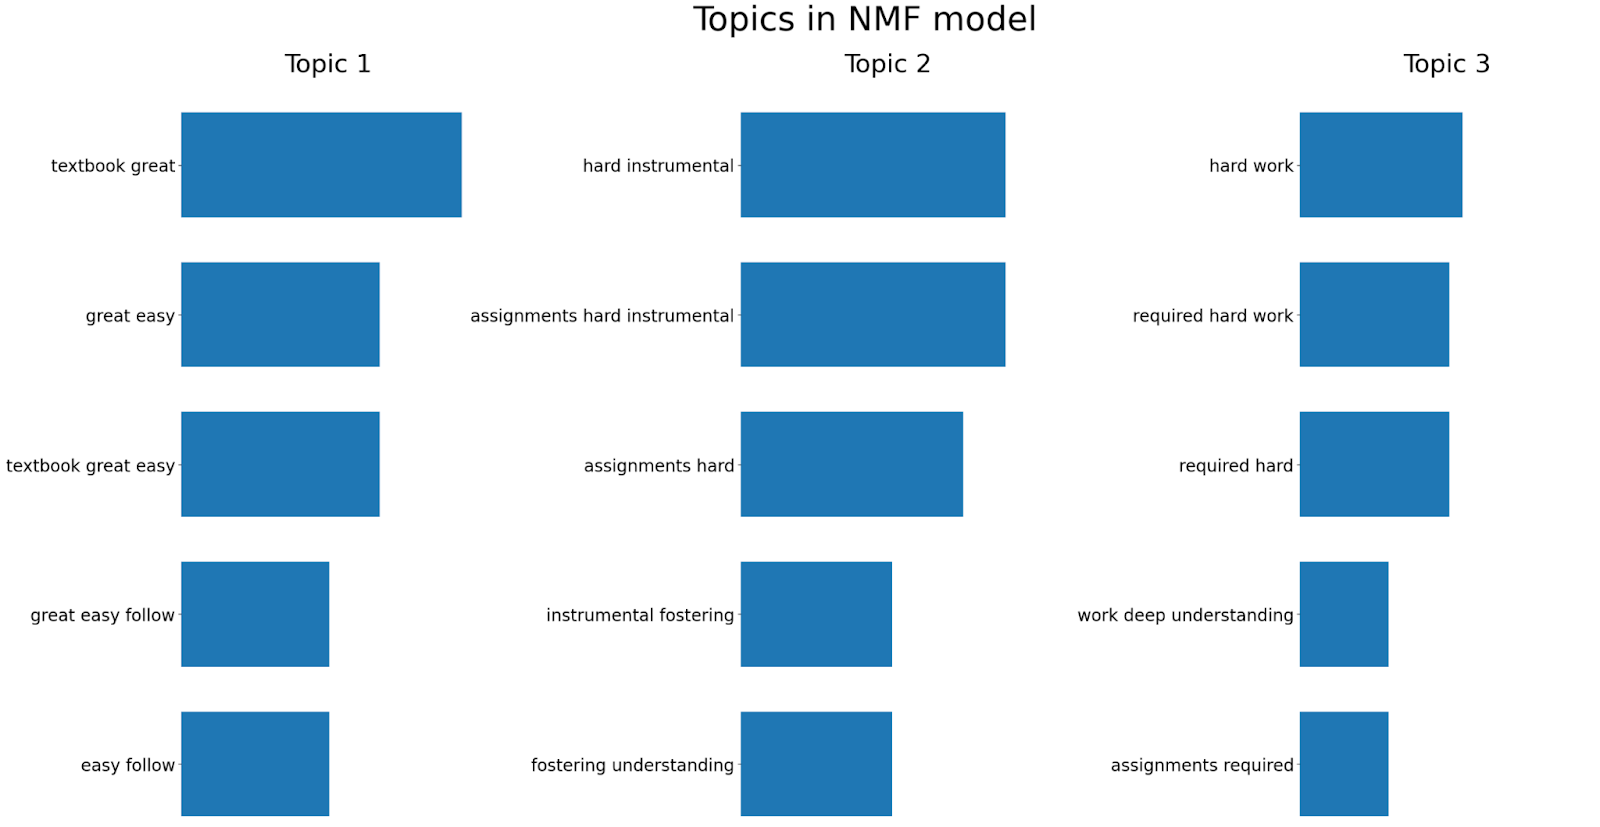
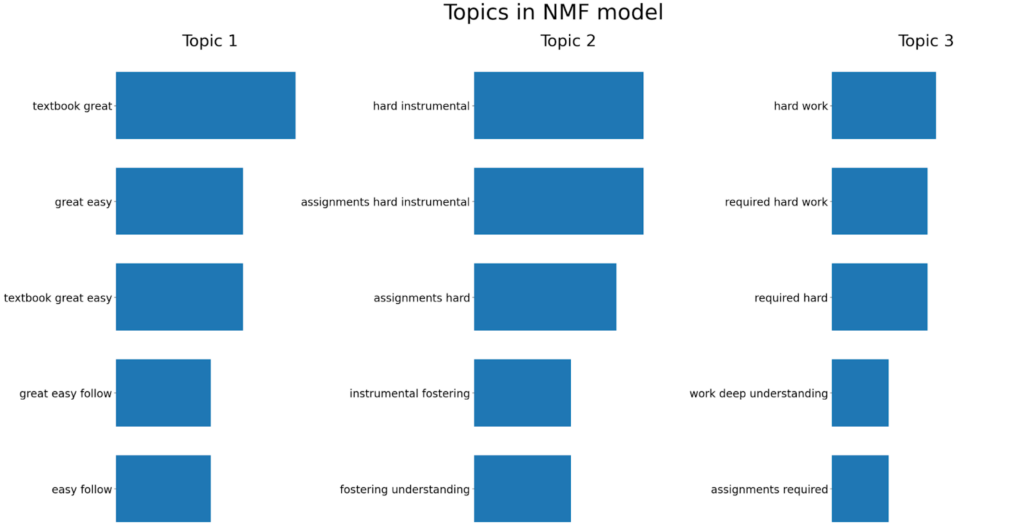
NMF 是一种无监督技术,可以降低输入数据的维度。更具体地说,它是一种强大的矩阵分解过程,可以将矩阵分解为两个非负矩阵 W 和 H 的乘积。默认情况下,NMF 优化原始矩阵和 WH 之间的距离。下面是一个示例,我们在其中应用 NMF 生成三个主题,并展示每个主题中五个重要的二元语法/三元语法。
from sklearn.feature_extraction.text import TfidfVectorizer
from sklearn.decomposition import NMF
from sklearn.pipeline import make_pipeline

# Create a TF-IDF vectorizer object
# TF-IDF (Term Frequency-Inverse Document Frequency) is a technique used to quantify a word in documents
# It is used to reflect how important a word is to a document in a collection or corpus
# The stop_words parameter is used to ignore common words in English such as 'this', 'is', etc.
# The ngram_range parameter is used to specify the size of word chunks to consider as features
tfidf_vectorizer = TfidfVectorizer(stop_words=stopwords_list, ngram_range=(2,3))

# Create an NMF (Non-Negative Matrix Factorization) object
# The n_components parameter is used to specify the number of topics to extract
nmf = NMF(n_components=3)

# Create a pipeline object that sequentially applies the TF-IDF vectorizer and NMF
pipe = make_pipeline(tfidf_vectorizer, nmf)

# Fit the pipeline to the reviews data
pipe.fit(df['reviews'])

def plot_top_words(model, feature_names, n_top_words, title):
    """
    Plot top words in topics
    source: https://scikit-learn.cn/stable/auto_examples/applications/plot_topics_extraction_with_nmf_lda.html#sphx-glr-auto-examples-applications-plot-topics-extraction-with-nmf-lda-py
    """
    import matplotlib.pyplot as plt
    fig, axes = plt.subplots(1, 3, figsize=(30, 15), sharex=True)
    axes = axes.flatten()
    for topic_idx, topic in enumerate(model.components_):
        top_features_ind = topic.argsort()[: -n_top_words - 1 : -1]
        top_features = [feature_names[i] for i in top_features_ind]
        weights = topic[top_features_ind]

        ax = axes[topic_idx]
        ax.barh(top_features, weights, height=0.7)
        ax.set_title(f"Topic {topic_idx +1}", fontdict={"fontsize": 30})
        ax.invert_yaxis()
        ax.tick_params(axis="both", which="major", labelsize=20)
        for i in "top right left".split():
            ax.spines[i].set_visible(False)
        fig.suptitle(title, fontsize=40)

    plt.subplots_adjust(top=0.90, bottom=0.05, wspace=0.90, hspace=0.3)
    plt.show()

# Plot the top words in the topics identified by the NMF model
plot_top_words(
    nmf, tfidf_vectorizer.get_feature_names_out(), 5, "Topics in NMF model"
)

分析产生了以下见解
这些发现为课程评论中的主要主题提供了宝贵的清晰度。

文本分析是一个有价值的工具,可以从非结构化文本数据中提供有意义的见解。在这篇博文中,我们介绍了文本分析的基础知识,包括在 Excel 中使用 Python 进行的 n 元语法分析和主题建模。通过利用 Python 库的这种新集成,您可以执行以前在熟悉的 Excel 界面中无法完成的分析。此外,您可以直接在 Excel 中与利益干系人轻松共享有价值的结果,他们在 Excel 中已经可以舒适地工作。
免责声明:Microsoft Excel 中的 Python 集成在本文发布时正处于 Beta 测试阶段。功能和函数可能会发生变化。如果您在此页面上发现错误,请随时联系我们。
Sophia Yang 是 Anaconda 的高级数据科学家和开发者倡导者。她对数据科学社区和 Python 开源社区充满热情。她是 condastats、cranlogs、PyPowerUp、intake-stripe 和 intake-salesforce 等多个 Python 开源库的作者。她在 Python 开源可视化系统 HoloViz 的指导委员会和行为准则委员会任职。她还在 NumFOCUS、PyData 和 SciPy 会议上担任志愿者。她拥有德克萨斯大学奥斯汀分校计算机科学硕士、统计学硕士和教育心理学博士学位。